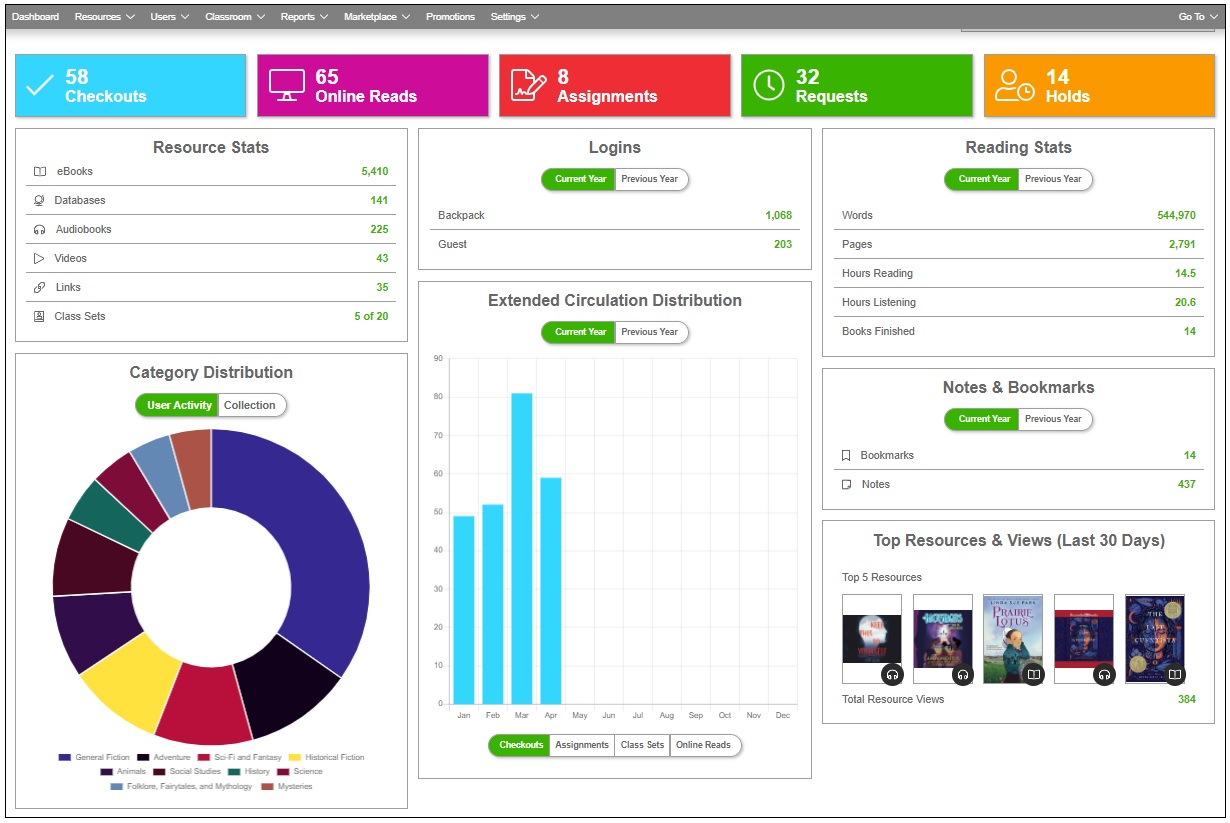
The Dashboard feature provides Administrators with a snapshot of activity in their MackinVIA account(s). Statistics and graphs offer analytical insights regarding resources, usage, and more. Data points include:
- Current circulation
- Resource statistics
- Login statistics
- Reading statistics
- Category activity and collection distribution
- Extended circulation distribution
- Note and bookmark statistics
- Top resources and total views
Please note: Circulation activity is updated dynamically on page refresh, while all other statistics are updated once a day.
Circulation
This section includes current totals for each circulation type. Click on the desired type to view titles in circulation and identify users with activity.

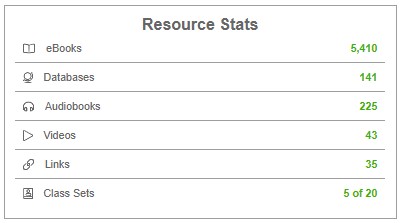
Resource Stats
This table includes current totals for each resource type, as well as current availability for class set titles. Totals are based on the number of active resources in the account; inactive resources are not included.
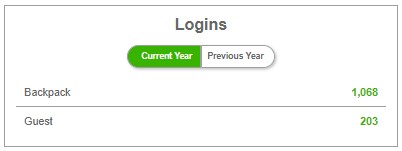
Logins
This table includes total logins for the account, divided into Backpack and Guest users. Click on the toggle buttons to view login information for the current year or previous year. Please note: Current and previous years are defined by calendar years.
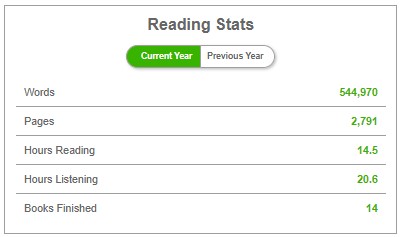
Reading Stats
This table includes an aggregate of user statistics. Activity captured by our metrics system includes number of words read, number of pages read, time spent reading/listening, and books finished. All statistics are calculated for Mackin-hosted eBooks and audiobooks; publisher-hosted resources are not included. Click on the toggle buttons to view statistics for the current year or previous year. Please note: Current and previous years are defined by calendar years.
- Words: Based on the number of words per page in an eBook and then calculated using the number of pages read.
- Pages: Based on the number of pages turned in an eBook. Users must spend at least 3 seconds on a page for it to count. Single-page and double-page views are considered when calculating this statistic.
- Hours Reading: Based on the amount of time users spend in eBooks. Users must be actively engaged in the eBook (page turning, highlighting, searching, etc) for the time to count. Idleness is considered when calculating this value and subtracted from the total time. Users are considered idle when there is no activity for 3 minutes.
- Hours Listening: Based on the amount of time users spend listening to audiobooks. Idleness is NOT factored into the total time.
- Books Finished: Based on the progress percentage in eBooks and audiobooks. Users must be over 90% through a title for it to count.
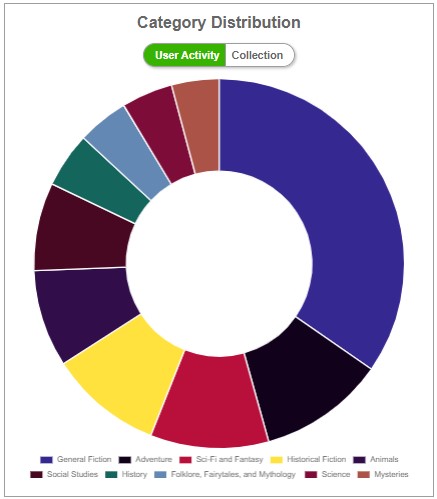
Category Distribution
This chart includes the top 10 categories based on the total number of resource views by users. Additionally, the top 10 categories based on the total resources in the account are included. Category totals only include active resources; inactive resources are not part of the calculation. Click on the toggle buttons to view category information by user activity or collection distribution.
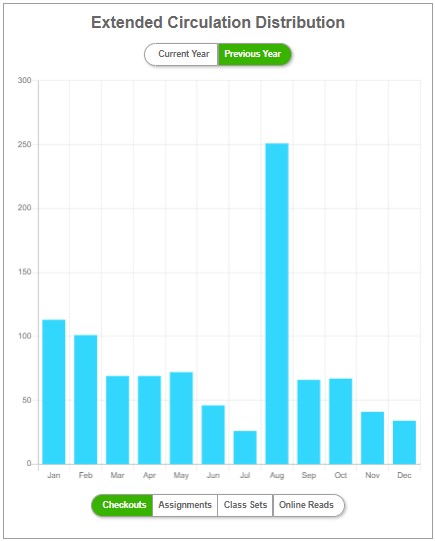
Extended Circulation Distribution
This graph includes circulation totals for checkouts, assignments, class sets, and online reads for the current year, detailed by month. Hover over the bars to view specific totals for each month. Click on the toggle buttons to view Extended Circulation Distribution information for the current year or previous year. Please note: Current and previous years are defined by calendar years.
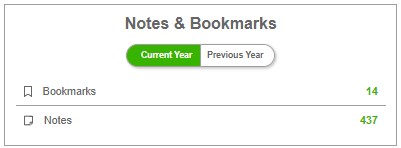
Notes & Bookmarks
This table includes the total number of bookmarks and notes in the account. Click on the toggle buttons to view annotation information for the current year or previous year. Please note: Current and previous years are defined by calendar years.
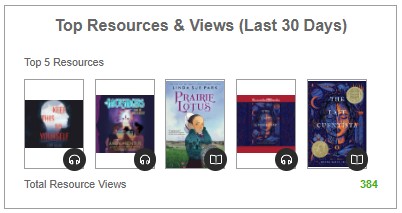
Top Resources & Views
Top Resources are the most frequently viewed items over the last 30 days. Views include both Mackin-hosted and publisher-hosted resources.